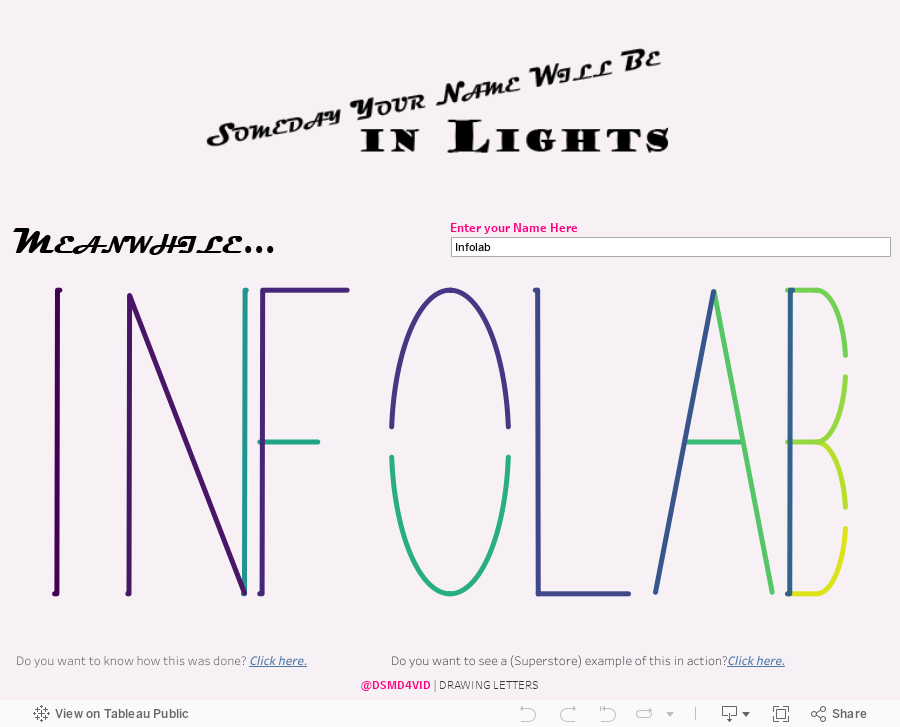
Little step-by-little step, making progress in my quest to understand what Tableau can offer beyond “Show me”. Inspired by Ken Flerlage‘s series of “the X & the Y“―but not quite yet at the level of parametric equations― I’m designing here a tool to use Tableau’s canvas as a blank slate to draw some letters (say goodbye to 72pt size limit!).
Aim:
Being able to enter a text (or, rather a 9-or-less-letter word) and draw it letter by letter using a combination of calculated fields in Tableau.
Steps:
Get the equations to draw the different letters in a given position ―template using Excel.
Transport the equations to all the different possible positions using Alteryx.
Desmo’s “Alphabet” page was a blessing.
Equations from https://www.desmos.com/calculator/l8u2vigxyb
1.2
Some of the equations in the page are not compatible with the way Tableau draws its marks:
You just cannot feed the equation needed to draw the letter “C” to Tableau.
The original equation: \[\left(x-1\right)^2+\left(y-1\right)^2=1\left\{x\le1.75\right\}\]
can be split in two segments for y: \[ y = 1+\sqrt{1 – \left(x-1\right)^2} \left\{x\le1.75\right\}\]\[ y = 1-\sqrt{1 – \left(x-1\right)^2} \left\{x\le1.75\right\}\]
that “1.75” is a placeholder for a given position of X -but will need to be updated for other positions.
1.3
En Excel (y con la ayuda de papel y lápiz para despejar la x y la y), con un poco de paciencia, reconvirtiendo todas las ecuaciones en función de la posición de x:
Muestra de las ecuaciones de los distintos trazos — click para descargar todas.
1.1
Desmo’s “Alphabet” page was a blessing.
Equations from https://www.desmos.com/calculator/l8u2vigxyb
1.2 Some of the equations in the page are not compatible with the way Tableau draws its marks:
You just cannot feed the equation needed to draw the letter “C” to Tableau.
The original equation: \[\left(x-1\right)^2+\left(y-1\right)^2=1\left\{x\le1.75\right\}\]
can be split in two segments for y: \[ y = 1+\sqrt{1 – \left(x-1\right)^2} \left\{x\le1.75\right\}\]\[ y = 1-\sqrt{1 – \left(x-1\right)^2} \left\{x\le1.75\right\}\]
that “1.75” is a placeholder for a given position of X -but will need to be updated for other positions.
1.3
In Excel (with the help of pen and paper to isolate x and y), and with a little bit of patience, reshaping the equations to draw based on x:
Sample of the different strokes –click to download all.
First Incursion into Alteryx - getting things ready.
Transport the equations to all the different possible positions using Alteryx.
Decide the number of letters that we’re going to use.
Convert the Excel template with the formulas to draw letters into proper Tableau Calculated Fields.
Repeat the process with the different positions defined in (1) (45 calcs right around the corner straight from here).
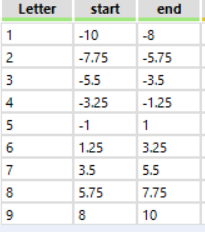
Restrict the number of letters to 9, with these characteristics (start & end defined as a function of the original equations, with a max-width per letter of 2 units and the position of the letter in the Tableau canvas).
Letter positioning.
2.2
Using Alteryx and the template obtained in (1.3) to automate the process.
Process the template to obtain the formulas for Tableau.
Doing this, for each letter we obtain a set of five formulas (one for each segment–some letters can be drawn using a single stroke i.e. “i”, while some other need up to 5 i.e. “b”).
Output of running the Alteryx workflow in the original template.
2.3
Combining the total number of letters with start & end (2.1) and the Alteryx workflow to obtain the text of the 45 formulas (2.2):
Let’s combine the possible positions with the stroke template.
And the output:
Output with the 45 calculations — click to download the Excel file.
2.1
Restrict the number of letters to 9, with these characteristics (start & end defined as a function of the original equations, with a max-width per letter of 2 units and the position of the letter in the Tableau canvas).
Letter positioning.
2.2 Using Alteryx and the template obtained in (1.3) to automate the process.
Process the template to obtain the formulas for Tableau.
Doing this, for each letter we obtain a set of five formulas (one for each segment–some letters can be drawn using a single stroke i.e. “i”, while some other need up to 5 i.e. “b”).
Output of running the Alteryx workflow in the original template.
2.3
Combining the total number of letters with start & end (2.1) and the Alteryx workflow to obtain the text of the 45 formulas (2.2):
Let’s combine the possible positions with the stroke template.
And the output:
Output with the 45 calculations — click to download the Excel file.
Tableau Template
Create a workbook in Tableau to use as a template.
Design the datasource.
Outline of the view to draw the letters: calculated fields and how to compute them using the bins from (1).
Calculate the different letters (which letters? what position?).
My aim is to simplify the datasource as much as possible and manipulate the different points in the strokes (and the x-axis) using Tableau’s ability to fill in the gap.
Original datasource:
Original datasource with a single row.
After unioning with itself:
Union to obtain two rows.Rows after the union.
Create a calculated field whose value changes with the table name (this step could also be parametrized but I’m hardcoding this as 100 for now):
Obtaining a min and max values based on the table name.
and
Bins to drive the position and strokes of the letters.
3.2
In a new worksheet:
The bins created earlier (padded) in detail to provide the context to compute the different table calculations.
The calculated field “t” is going to be the “x-axis”. Adjusted with hardcoded values of 100 y 200 based on padded.
“t”~ Index & Size to position the letters, computed using “padded”.
With “t” and “padded” ready, the only thing left is to bring into the view the calculated fields for the segments of all the letters. I’m using only a couple as an example, where I copy the text generated earlier. All the calculated fields will be created in Alteryx using this as a template.
Each segment needs to be computed using padded –for t and for letter.
Getting the worksheet ready – Click to magnify.
With this, we are (almost) ready to automate the steps.
3.3
To calculate the letters (which letters and where) we can combine some calculated fields:
The first one, that I called “Name_letters“, is based on a parameter (in this example; however, it could vary based on other measures, say the sum of sales as seen here —example).
Obtaining the text to draw based on a parameter. Could be replaced with a calculated field based on other measures as seen here.
Next, one calculated field per letter. Given that the different intermediate points do not exist in the datasource (rather, they’re generated with the bins) it is necessary to use table calculations to retrieve them:
Obtaining the first letter–table calculations are needed here.Changing the “start position” of the table calculation we can obtain the different letters.
Finally, a calculated field based on the x-axis to decide which letter goes where.
Deciding which letter to draw where based on the position in the x-axis.Hardcoded.
3.1
My aim is to simplify the datasource as much as possible and manipulate the different points in the strokes (and the x-axis) using Tableau’s ability to fill in the gap.
Original datasource:
Original datasource with a single row.
After unioning with itself:
Union to obtain two rows.Rows after the union.
Create a calculated field whose value changes with the table name (this step could also be parametrized but I’m hardcoding this as 100 for now):
Obtaining a min and max values based on the table name.
and
Bins to drive the position and strokes of the letters.
3.2 In a new worksheet:
The bins created earlier (padded) in detail to provide the context to compute the different table calculations.
The calculated field “t” is going to be the “x-axis”. Adjusted with hardcoded values of 100 y 200 based on padded.
“t”~ Index & Size to position the letters, computed using “padded”.
With “t” and “padded” ready, the only thing left is to bring into the view the calculated fields for the segments of all the letters. I’m using only a couple as an example, where I copy the text generated earlier. All the calculated fields will be created in Alteryx using this as a template.
Each segment needs to be computed using padded –for t and for letter.
Getting the worksheet ready – Click to magnify.
With this, we are (almost) ready to automate the steps.
3.3
To calculate the letters (which letters and where) we can combine some calculated fields:
The first one, that I called “Name_letters“, is based on a parameter (in this example; however, it could vary based on other measures, say the sum of sales as seen here —example).
Obtaining the text to draw based on a parameter. Could be replaced with a calculated field based on other measures as seen here.
Next, one calculated field per letter. Given that the different intermediate points do not exist in the datasource (rather, they’re generated with the bins) it is necessary to use table calculations to retrieve them:
Obtaining the first letter–table calculations are needed here.Changing the “start position” of the table calculation we can obtain the different letters.
Finally, a calculated field based on the x-axis to decide which letter goes where.
Deciding which letter to draw where based on the position in the x-axis.Hardcoded.
Second Incursion into Alteryx and Last Touch Ups in Tableau
Generate all the different calculations and place them in the worksheet computing as needed in the workbook using Alteryx.
Understanding the differences between the calculations previously obtained in Alteryx and the structure that calculated fields have in Tableau.
Transform text into HTML and creating the formulas following Tableau’s format.
Update the worksheet to use the calculated fields making sure they are computed correctly using padded.
Alteryx workflow detailing the steps outlined in 4.3.
The formula obtained so far in Alteryx is in plain text. This is only useful to copy them in an open instance of Tableau when creating a calculated field. BUT, it’s not going to be apt for programmatically creating all the fields.
Plain text formula as it is currently obtained from Alteryx.Useful only as a cut-and-paste exercise in calculated fields in Tableau.Formula as it is actually stored in the XML of Tableau’s workbook.
In the XML of Tableau’s workbook, formulas are stored as “HTML” (i.e “>” is translated into “>”). In addition, this text is only the “formula“. Tableau needs additional details for each calculated field (the name, type, alias… and, in the case of calculated fields, the default instructions to compute them).
Fortunately, all this can be automated in Alteryx using one existing calculation as a template.
4.2
Starting from the template obtained earlier (2.3), and using an HTML reference table it is quite easy to replace the needed values using “Find and Replace” in Alteryx.
From plain text to HTML.
Once we get the HTML encoded formula, it has to be moved inside the XML of the workbook. Welcome to some minor “XML hacking” where we’ll be editing the XML of the .twb instead of using the “drag&drop” interface.
To make things easier, I’ve first edited the workbook in a text editor to create a template calculation based on the calculated fields in 4.1.
Template calculated field.
This template can now be updated in Alteryx to create N calculated fields (45 in this instance).
Extract the template calculated field from the workbook.
Using that template to create all the needed calculated fields:
Generating the workbook with all the calculated fields based on the template. Download the Alteryx workflow here.
4.3
Let’s have a look at the XML in the workbook again. This time, just focus on the structure of the worksheet:
Tableau’s worksheet.
There are three sections were calculated fields will need to be added:
Worksheet structure as seen in the XML.
It seems clear that, given that we are using “Measure Names”, to be able to add additional calculated fields we have to edit the “categorical filter”. We’ll need to add as many “Groupfilter” sections as calculated fields.
Rows will have the measure values and “t” in columns.
To compute the full-range of padded we’ll need to show empty rows from the table layout option.
BUT… THIS. IS. NOT. ALL.
Having a look at “Datasource dependencies” we’ll find out that two entries are needed for each of the calculated fields that we want to add to the view.
The first one is just the same one used earlier with the field name, alias, type, etc.
Calculated field definition, the same as the one used earlier.
The second one, “column-instance“, contains the specific information needed for this particular view, including how to compute it.
This view’s specific information — detailing how to compute it.
4.4
Let’s see how to automate all this in Alteryx:
Using as input the .twb file (read as .csv, with no delimiters and concatenating everything in a single record), we can extract the information for the worksheet (named TEST in this example).
Obtaining the worksheet.
Next, the “Measures Names” filter can be updated to contain all the needed calculated fields:
Obtaining the updated “groupfilter”.
The calculated fields definitions obtained earlier (with name, type, etc.) need to be present also in the worksheet datasource-dependencies section:
Updating the calculated fields definitions.
These definitions do not include the information needed to compute the table calculations in the current view. These are part of the “column-instance” section that can also be updated:
Specific definition with the how to compute for the particular view.
Finally, we need to restore the “placeholder” values in the workbook:
Restoring the workbook.
and… we start from a test worksheet to a worksheet with all the strokes for all the letters computing properly. The only things left are changing the graph to line, adding “measure names” to colour and…(formatting, always formatting):
And just some more formatting left…
The full workflow in Alteryx:
Complete Alteryx workflow– download it here.
4.1
The formula obtained so far in Alteryx is in plain text. This is only useful to copy them in an open instance of Tableau when creating a calculated field. BUT, it’s not going to be apt for programmatically creating all the fields.
Plain text formula as it is currently obtained from Alteryx.Useful only as a cut-and-paste exercise in calculated fields in Tableau.Formula as it is actually stored in the XML of Tableau’s workbook.
In the XML of Tableau’s workbook, formulas are stored as “HTML” (i.e “>” is translated into “>”). In addition, this text is only the “formula“. Tableau needs additional details for each calculated field (the name, type, alias… and, in the case of calculated fields, the default instructions to compute them).
Fortunately, all this can be automated in Alteryx using one existing calculation as a template.
4.2
Starting from the template obtained earlier (2.3), and using an HTML reference table it is quite easy to replace the needed values using “Find and Replace” in Alteryx.
From plain text to HTML.
Once we get the HTML encoded formula, it has to be moved inside the XML of the workbook. Welcome to some minor “XML hacking” where we’ll be editing the XML of the .twb instead of using the “drag&drop” interface.
To make things easier, I’ve first edited the workbook in a text editor to create a template calculation based on the calculated fields in 4.1.
Template calculated field.
This template can now be updated in Alteryx to create N calculated fields (45 in this instance).
Extract the template calculated field from the workbook.
Using that template to create all the needed calculated fields:
Generating the workbook with all the calculated fields based on the template. Download the Alteryx workflow here.
4.3
Let’s have a look at the XML in the workbook again. This time, just focus on the structure of the worksheet:
Tableau’s worksheet.
There are three sections were calculated fields will need to be added:
Worksheet structure as seen in the XML.
It seems clear that, given that we are using “Measure Names”, to be able to add additional calculated fields we have to edit the “categorical filter”. We’ll need to add as many “Groupfilter” sections as calculated fields.
Rows will have the measure values and “t” in columns.
To compute the full-range of padded we’ll need to show empty rows from the table layout option.
BUT… THIS. IS. NOT. ALL.
Having a look at “Datasource dependencies” we’ll find out that two entries are needed for each of the calculated fields that we want to add to the view.
The first one is just the same one used earlier with the field name, alias, type, etc.
Calculated field definition, the same as the one used earlier.
The second one, “column-instance“, contains the specific information needed for this particular view, including how to compute it.
This view’s specific information — detailing how to compute it.
4.4
Let’s see how to automate all this in Alteryx:
Using as input the .twb file (read as .csv, with no delimiters and concatenating everything in a single record), we can extract the information for the worksheet (named TEST in this example).
Obtaining the worksheet.
Next, the “Measures Names” filter can be updated to contain all the needed calculated fields:
Obtaining the updated “groupfilter”.
The calculated fields definitions obtained earlier (with name, type, etc.) need to be present also in the worksheet datasource-dependencies section:
Updating the calculated fields definitions.
These definitions do not include the information needed to compute the table calculations in the current view. These are part of the “column-instance” section that can also be updated:
Specific definition with the how to compute for the particular view.
Finally, we need to restore the “placeholder” values in the workbook:
Restoring the workbook.
and… we start from a test worksheet to a worksheet with all the strokes for all the letters computing properly. The only things left are changing the graph to line, adding “measure names” to colour and…(formatting, always formatting):
And just some more formatting left…
The full workflow in Alteryx:
Complete Alteryx workflow– download it here.
Summary
In this post, I have started to draw letters in Tableau; deepened the exploration of the X-Y relationship; used bins to make values accessible through table calculations while Tableau fills all the gaps with its magical “gap awareness” (domain completion? densification? domain padding? check this to learn more).
In addition, I introduced a couple of sections of the XML structure in the .twb file and I created, programmatically, near to 50 calculated fields (and showed how to place them in a worksheet!).
Some links to resources: